Level: Intermediate
The forthcoming Customer Service Act will require companies providing customer service to implement a rating system to measure customer satisfaction.
CSAT surveys are ideal for this purpose. In addition to telling us what percentage of customers are satisfied, they can be conducted through any channel in a contact centre: phone, chat, WhatsApp, email, SMS, etc.
In this post, we’ll look at what they are, how to calculate the result and how to use them in a contact centre. Let’s dive in!
1. WHAT IS CSAT?
CSAT stands for Customer Satisfaction Score and it’s used to measure customer satisfaction.
This metric is used to understand how satisfied our customers are with a product, service or contact point, such as customer service.
CSAT scores are derived from short surveys that ask very specific questions, such as “How satisfied are you with the response to your inquiry? Customers provide a rating, which we then quantify.
The result of a CSAT survey, usually expressed as a percentage, shows the number of customers who are satisfied with a very specific process/action or product/service.
So there’s no better metric for identifying friction points in the customer experience and working on continuous improvement.
2. CSAT VS. NPS
Customer Satisfaction Score (CSAT) and Net Promoter Score (NPS) are both metrics derived from feedback surveys conducted with our customers, but each serves a different purpose.
While CSAT measures satisfaction with a very specific aspect, NPS measures the willingness of customers to recommend our brand to others.
On the face of it, both measure customer satisfaction, because nobody recommends a brand they’re not happy with. However, the data we get from an NPS survey gives us information at a general level and doesn’t allow us to measure individual customer service experiences, as CSAT surveys do.
3. WHEN IS CSAT USED?
All companies that want to measure their customers’ experience should conduct CSAT surveys: there’s nothing better than listening to our customers to make improvements in any area of the business.
In fact, leading companies using agile methodologies are already integrating customer feedback into their workflows to build their product/service roadmaps. This allows them to develop specific features for customers and have a much more competitive end product.
Listening to our customers not only has a positive impact on customer satisfaction metrics, but also impacts the business with customer retention and sales strategies for loyalty.
Have you noticed that more and more companies are integrating the role of the CX manager? Welcome to the 21st century! Today, customer experience is critical; it’s a competitive advantage, and consumers value it even more than price and product/service quality.
4. HOW ARE CSAT SURVEYS CONDUCTED?
CSAT surveys usually consist of a single question, as their purpose is to assess satisfaction with a very specific aspect. If there is a second question, it’s usually to provide optional clarifying comments.
Applied to customer service, the question would be designed to assess, for example, the service received from an agent, the experience of contracting a service, or the time taken to resolve an incident.
As well as knowing what we’re going to ask, we also need to design the response format we’ll use. There are two methods: numerical or graphical ratings and the Likert scale.
4.1 NUMERICAL OR GRAPHICAL SCORES
There’s no hard and fast rule about the length of the rating scale, but it’s most common to give three, five or seven options, although sometimes it goes up to ten. Why? Because odd numbers help us draw a line between negative and positive ratings.
Remember that the results of CSAT surveys are usually calculated using only positive ratings.
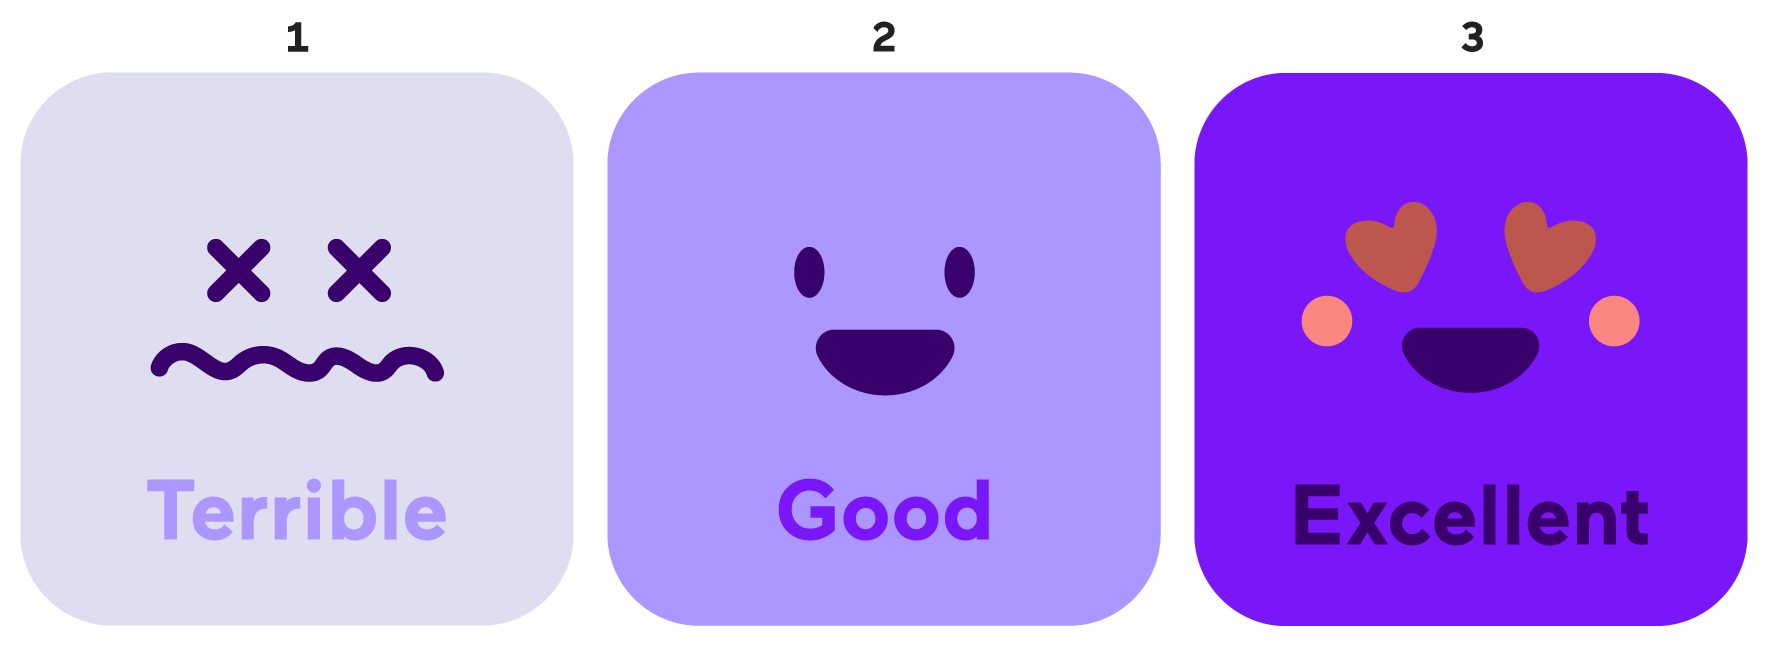
EXAMPLE OF THREE GRAPHICAL OPTIONS

If we give three alternatives, the second option divides the negative (“terrible”) and positive (“excellent”) ratings.
This format is useful for a website or app, for example. When the customer accesses their account to view the ticket resolution, they can click or tap on one of the three options.
EXAMPLE OF FIVE GRAPHICAL OPTIONS

In the group of five, the dividing line is drawn at three, so that the fourth and fifth stars are considered positive ratings.
This format can be very interesting when asking for ratings via WhatsApp; the customer can send us the stars using emoticons.
EXAMPLE OF SEVEN NUMERICAL OPTIONS

Numerical ratings, although odd, also allow us to quickly see that five, six and seven are positive ratings.
This format is ideal for phone channels as it allows the customer to say or dial a number.
4.2 LIKERT SCALE
This method has five options:
- Very dissatisfied (1)
- Dissatisfied (2)
- Neither satisfied nor dissatisfied (3
- Satisfied (4)
- Very satisfied (5)
In this scale, if we are measuring only positive responses, we should add ‘satisfied’ and ‘very satisfied’.
The Likert scale can be used when conducting an online survey. When we send a link via email or SMS, customers can mark the option that best represents their experience.
5. HOW IS CSAT CALCULATED?
Whether the answer is a number, a symbol or a word, everything can be quantified. If you’ve used numbers, you already have a numerical value, but if you’ve used graphical elements or words as an answer, you’ll need to convert them into numbers.
Go back to the previous examples and notice that each word in the Likert scale and each graphic element has a number above it (if you have already noticed: congratulations!).
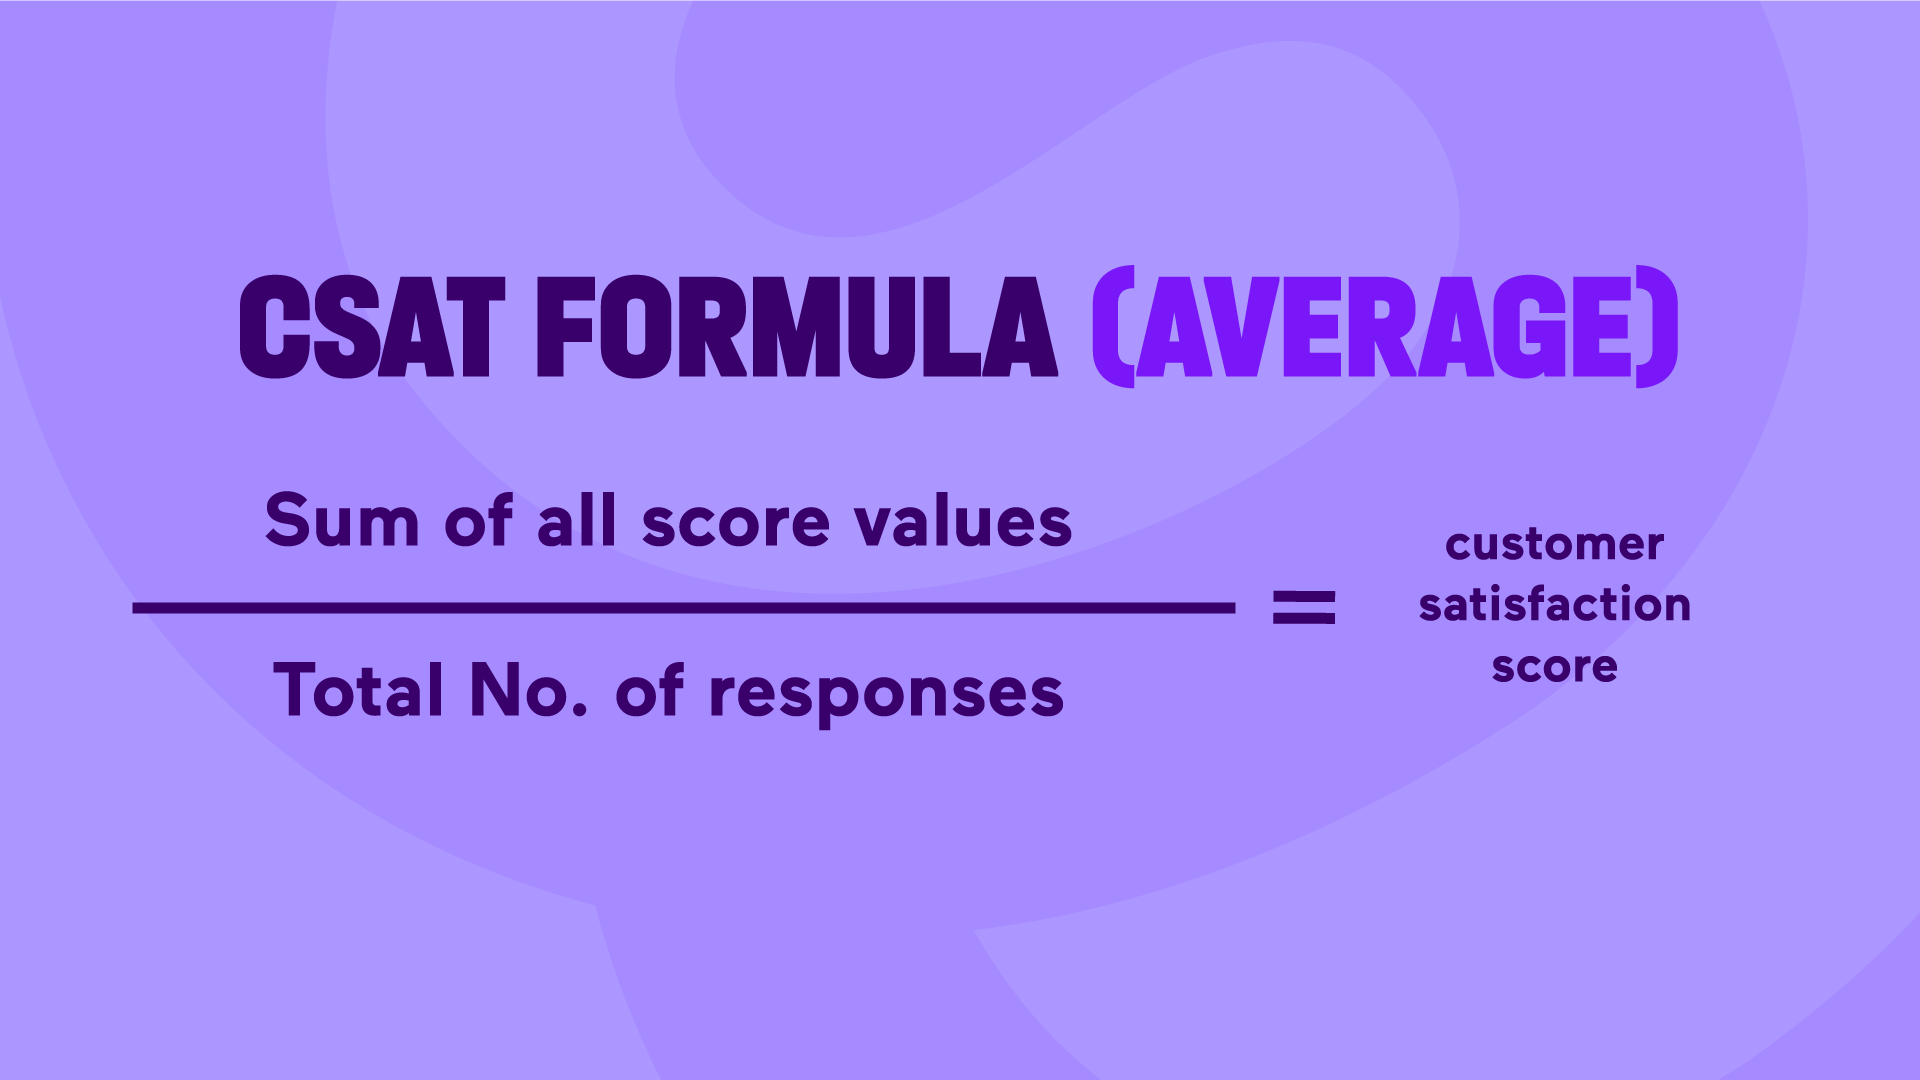
Once we have assigned values, we can calculate the CSAT score. Depending on the information we want to extract, we’ll use one of these formulae:
5.1 AVERAGE SCORE
This formula gives us an overall picture of the responses, so we’ll look at all the scores (not just the positive ones).

Let’s say we used a numerical scale from 1 to 7:
| Score | Number of responses |
| 1 | 1 |
| 2 | 1 |
| 3 | 2 |
| 4 | 0 |
| 5 | 2 |
| 6 | 1 |
| 7 | 1 |
To calculate the total number of ratings, we’ll multiply each value by the number of people who responded to it.
(1 x 1) + (2 x 1) + (3 x 2) + (4 x 0) + (5 x 2) + (6 x 1) + (7 x 1) = 32
And to find the total number of votes, we add up the number of people.
(1 + 1 + 2 + 0 + 2 + 1 + 1) = 8
If we divide 32 by 8, we get a CSAT score of 4 out of 7.
Although the average is not usually expressed as a percentage, we can quickly calculate it by dividing 4 by 7 and multiplying the result by 100. We get 57.14%.
Note that this is the “average score”, not the percentage of satisfied customers.
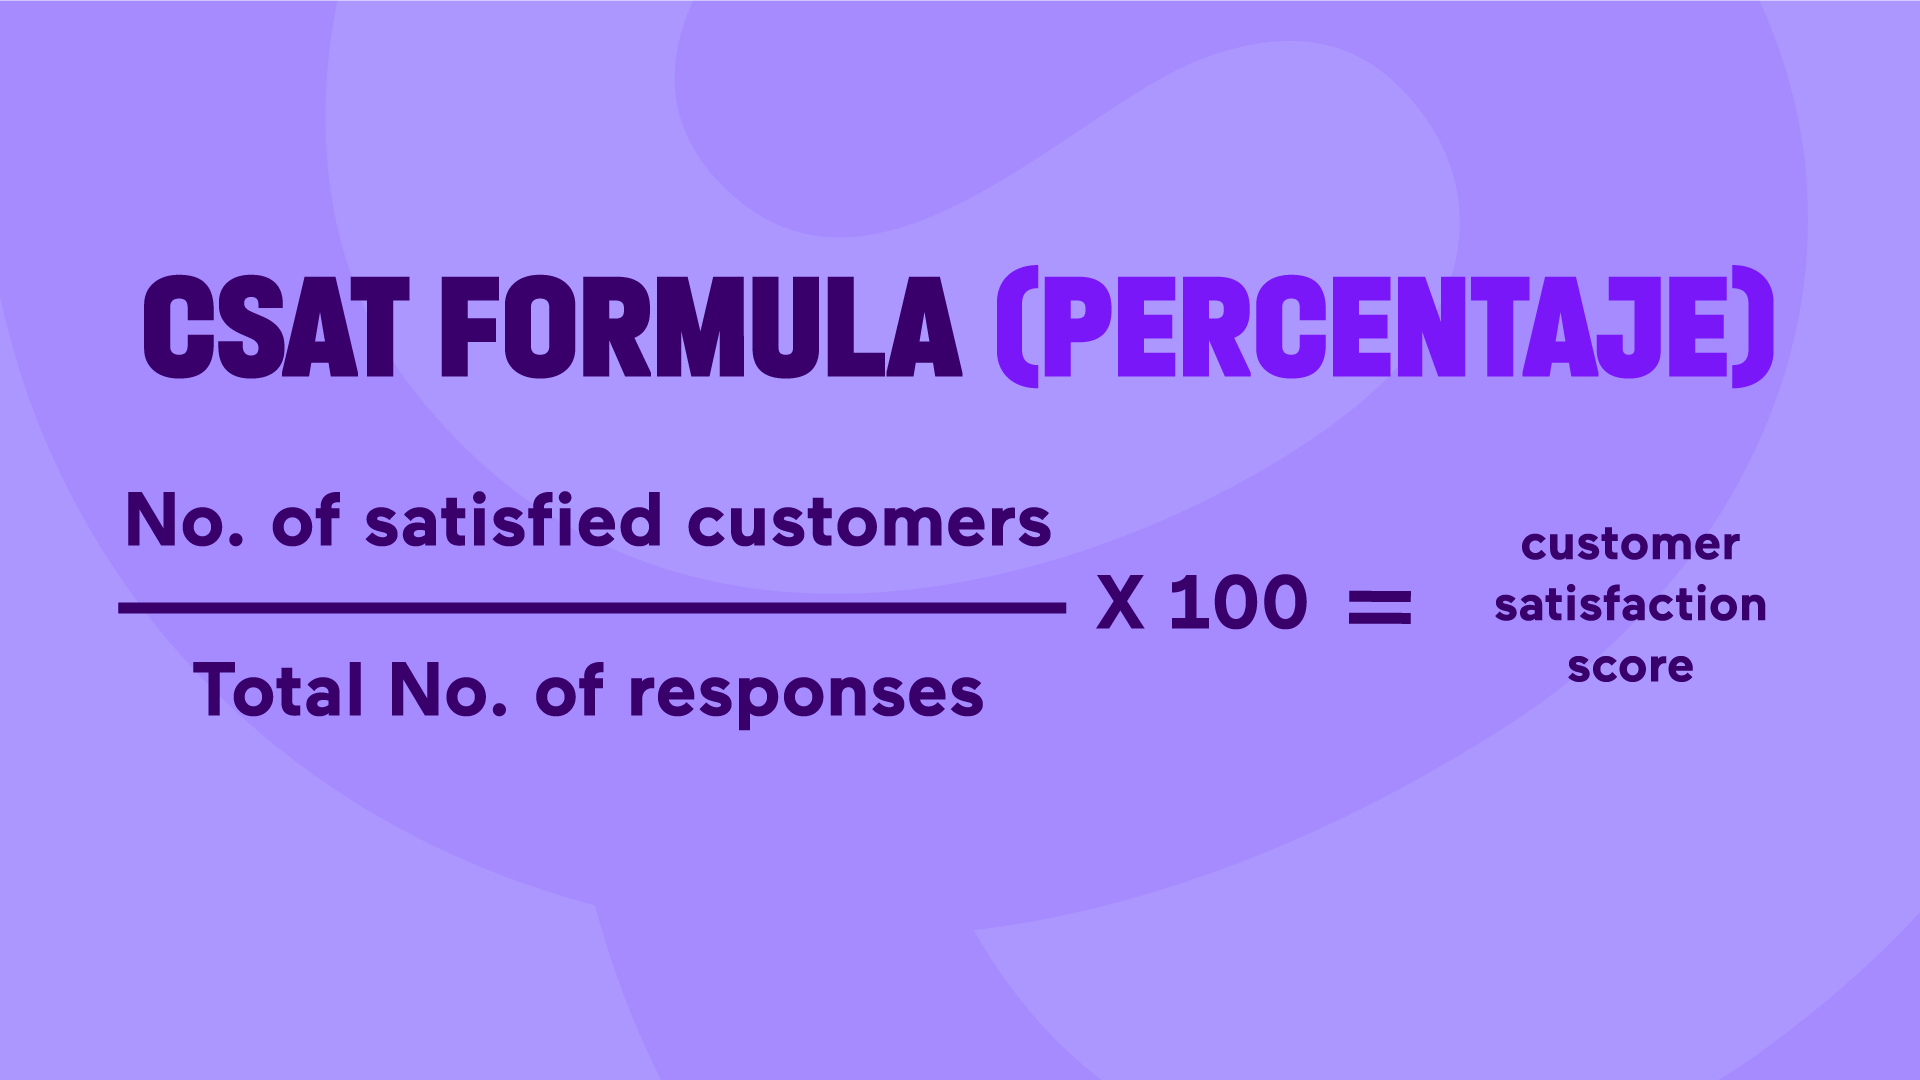
5.2 PERCENTAGE OF SATISFACTION
If we just want to know how many customers are satisfied, we’ll use this formula:

Using the previous example:
| Score | Number of responses |
| 1 | 1 |
| 2 | 1 |
| 3 | 2 |
| 4 | 0 |
| 5 | 2 |
| 6 | 1 |
| 7 | 1 |
This time we’ll only take into account positive ratings, so we’ll just add up the number of people who gave us a rating of more than 4.
(2 + 1 + 1) = 4
And the total number of people who responded to the survey remains the same, still 8.
So if we divide 4 by 8, the CSAT score is 50%.
If we want to calculate the percentage of negative ratings, we’ll use the previous formula, but only take into account the people who rated us below 4.
6. WHAT PERCENTAGE OF CSAT IS GOOD?
When we calculate the CSAT score for the first time, we don’t have a historical record of how ‘good’ or ‘bad’ we are doing.
As a guide, we can say that:

- Good: In general, a CSAT score of 80% or above is considered good. This means that at least 80% of customers surveyed are satisfied or very satisfied with the service we’ve provided.
- Neutral: A score between 70% and 79% could be considered neutral. This indicates that most customers are satisfied, but there is still room for improvement.
- Poor: A percentage below 70% would generally be considered poor. This indicates that a significant proportion of customers surveyed are dissatisfied with the service they’ve received and we need to make significant improvements to address their concerns and improve the customer experience.
7. WHAT DO WE DO IF WE HAVE A NEGATIVE CSAT SCORE?
As customer service managers, we need to identify what’s wrong and what we need to do to fix it.
Firstly, we’ll make a list of all the questions where we score below 70% and rank them from lowest to highest.
For example, if our worst score is 40% and the question is ‘What do you think of the speed of our customer service’, we need to take urgent action to respond to customers more quickly.
We can adjust queue parameters within the contact centre software and route agents more effectively, or implement chatbots and callbotsto speed up intent qualification, or even offer self-service and free up agents from simple enquiries.
In addition to addressing the direct aspects that cause delay, it would also be interesting to examine the indirect elements, such as the After Work Call (AWC) times for each agent.
If we find that agents are spending more time in AWC than on calls, it could mean that the ticketing system is very old or not integrated with the contact centre solution, meaning that the current system is slowing agents down.
Once we’ve identified all the areas for improvement, we need to prioritise those that remove the most friction to see an immediate change in our average and percentage CSAT scores.
8. HOW TO IMPLEMENT THE CSAT SYSTEM IN CUSTOMER SERVICE
Once the Customer Service Act comes into force, all companies offering customer service will have to implement CSAT surveys.
So now is the time to start conducting them from your contact centre software or your CRM.
Once we’ve decided which platform to use, we’ll make a list of where and when, i.e. through which channels and after which actions, we’ll ask your customers for feedback.
If we’re going to work on continuous improvement of CSAT surveys, it’s a good idea to use the Customer Feedback Loop methodology.

Customers will feel that their opinions don’t “fall on deaf ears”; they will feel heard and empowered.
Have more questions about implementing CSAT surveys in customer service? Contact our team of experts on +34 900 670 750 or fill out this form.
 Subscribe
 Ask for a demo

 8 min
8 min
